Anomaly Detection
Anomaly detection using hyperspectral images
Kernel-RX algorithm can be thought as a nonlinear version of the RX algorithm. In Kernel-RX algorithm, via a certain nonlinear mapping function, the input space is transformed to a high dimensional feature space. Using the well-known kernel trick, the implementation of Kernel-RX algorithm becomes possible. This algorithm has been noted to yield improved performance in comparison to the conventional RX algorithm. We have implemented Kernel RX algorithm and applied it to a hyperspectral image supplied by the Wright Patterson AF Base.
The following figure shows one band of the hyperspectral image with some panels and targets (black dots with white circles on the grass near the panels.
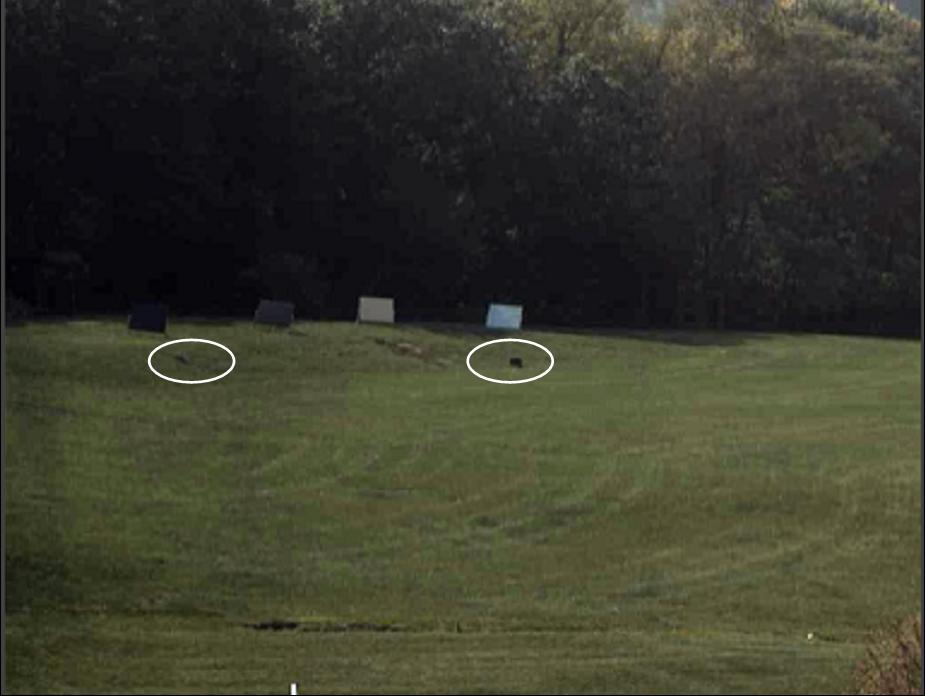
Fig. 1: Hyperspectral image with targets (Image from the AF). Dots inside white circles are anomalies.
Here we show some results of applying KRX to an AF hyperspectral image, which is the same as Fig. 2. Our objective is to detect the two small anomalies with white circles in the image. Fig. 2 shows the ROC curves of KRX for two design parameters. Both work well. Fig. 3 shows the detection results. The two small targets have been correctly detected.
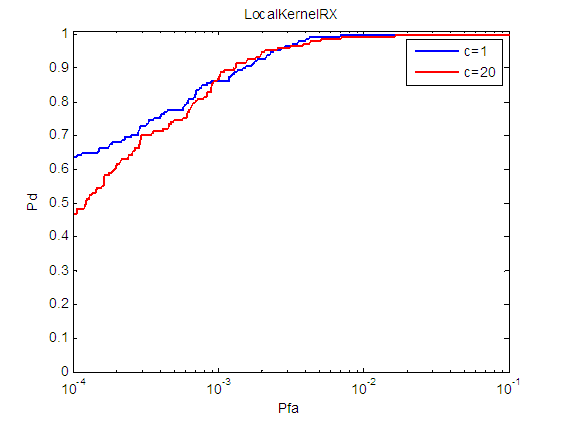
Fig. 2: ROC curve of using KRX. c is a design parameter in KRX.
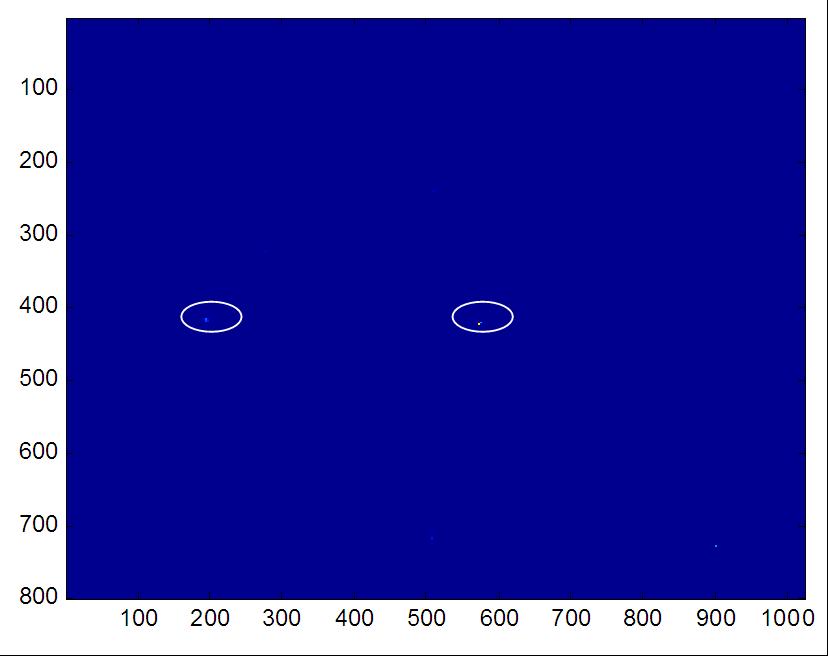
Fig. 3: Anomaly detection results using KRX. The window size is 45x45 so we can only detect the two small anomalies in the image. If larger windows were used, we can also detect the panels.
Fast Approximation of Kernel RX(KRX)
In kernel methods, the dimension of kernel matrix is the number of samples. In reality, it's common to have a lot of samples and thus the raw kernel matrix will be too large to even stored in memory. A simple and popular strategy is use downsampling to reduce the number of samples. However, the performance is not good when the down sampling ratio is large. We developed a novel technique called CKRX which can significantly improve the approximation performance with the same number of samples.
A Simulation Example
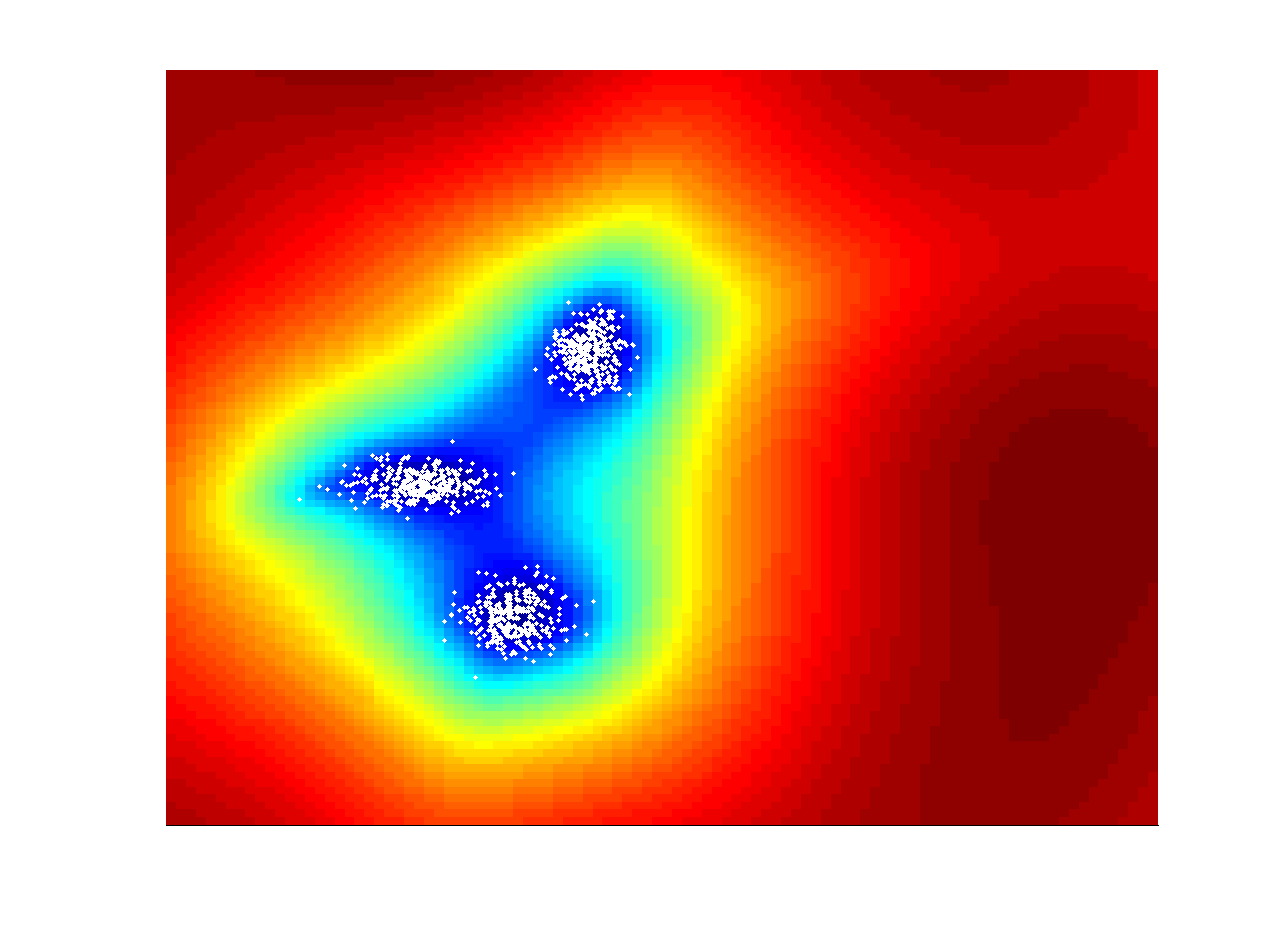
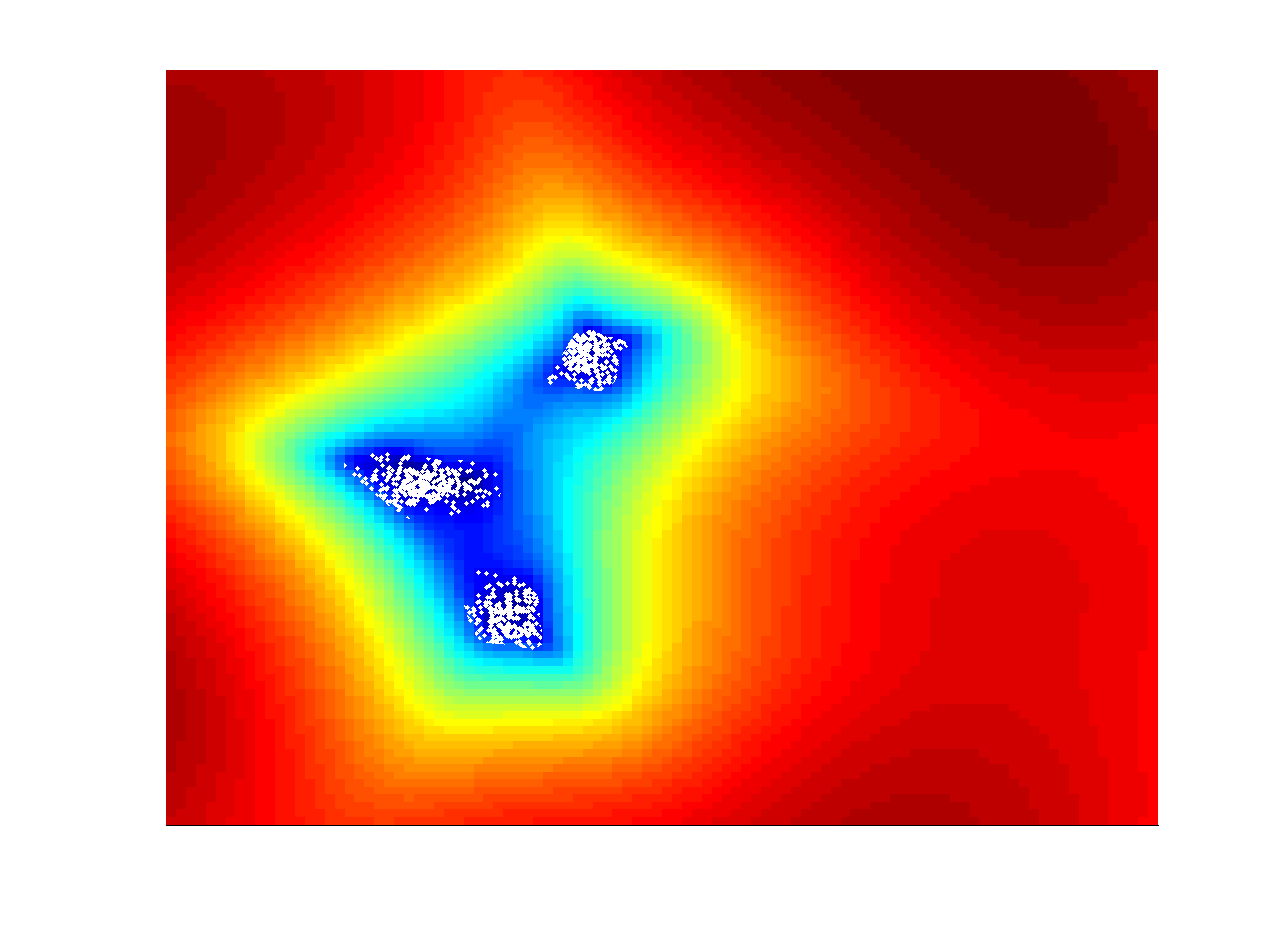
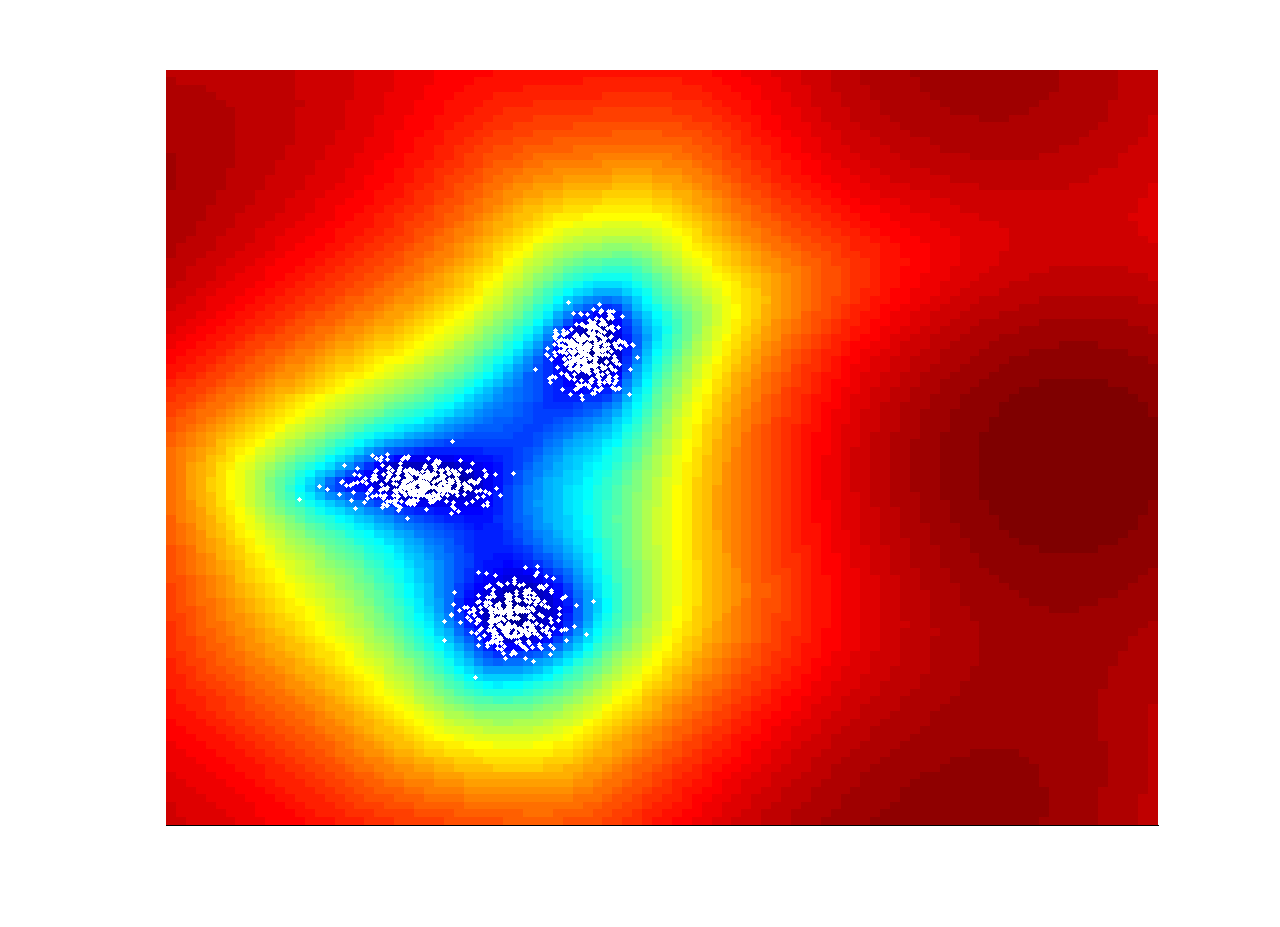
The following figure shows an example of CKRX applied to a synthetic data set. The data model is a mixture of Gaussian and there are 1000 points. The kernel is a Gaussian kernel. The color in the image corresponds to the log of the anomaly values. The results using KRX, KRX with sub-sampling and CKRX are shown in left, center and right respectively. The number of the original data points is 1000 and the data point number in both sub-sampled KRX and CKRX is 50. From the image, we can found that the CKRX provides better approximation than sub-sampled KRX.
| KRX with 1000 points | KRX with random 50 points | CKRX with 50 points |
 |
 |
 |
